Site Traffic
What this is for, in one sentence: Site Traffic shows what AI answers actually send you — the visits, and more importantly the signups, that arrived from an AI answer — so the visibility work in every other module connects to a number your leadership already cares about.
When to come here:
- When someone asks the only question that ultimately matters: “did any of this produce customers?”
- After shipping fixes and content, to watch the citation → click → conversion chain complete
- Monthly, to keep an honest baseline of what AI channels contribute — before you need the answer under pressure
Sarah Lim has spent the quarter improving MenuPilot’s AI visibility — coverage up, ranking up, facts fixed. This is the screen where that work has to cash out, and it does it in plain terms: not “AEO performance”, but visits AI sent you and what they did next.
What AI sent you
Section titled “What AI sent you”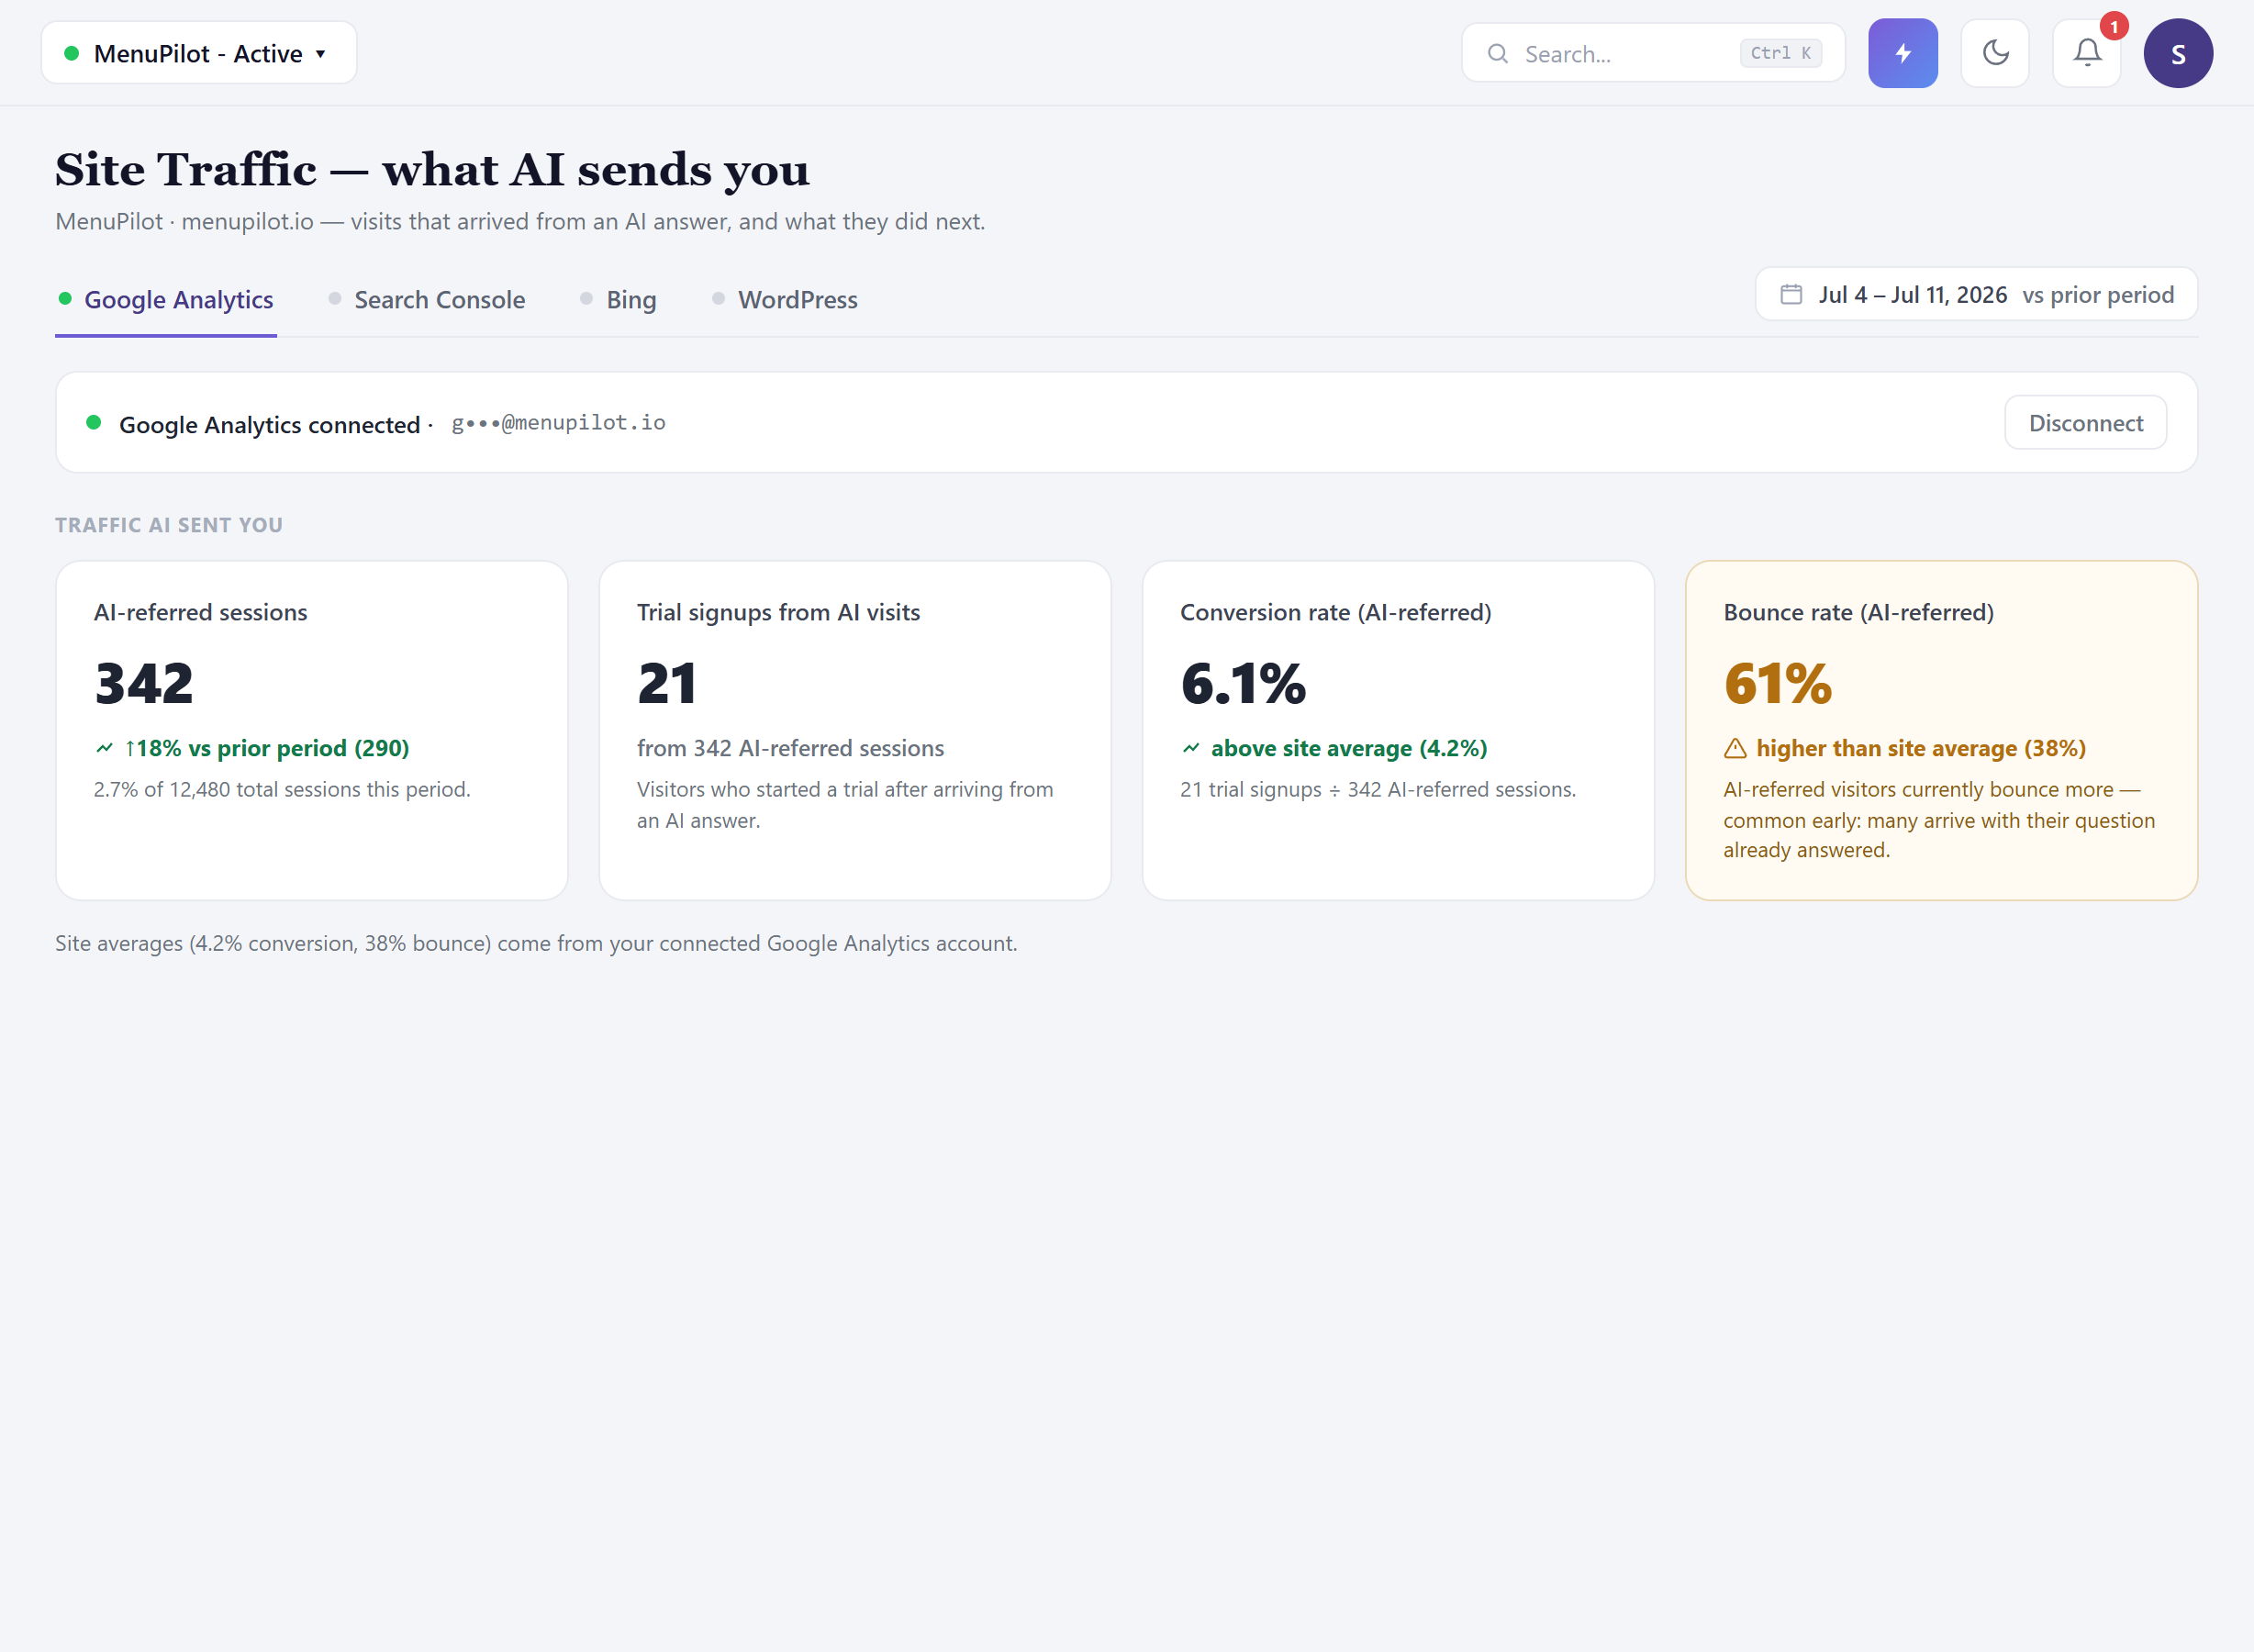 The header keeps it plain: visits that arrived from an AI answer, and what they did next. Data comes from your connected analytics — the chip at the top shows the Google Analytics connection is active, so you always know which account the numbers are coming from.
Four cards carry the summary, and each one with a comparison prints it right there on the card:
- AI-referred sessions: 342, up 18% on the prior period’s 290.
- Trial signups from AI visits: 21. The card leads with conversions, not clicks, because 21 trials is the number that survives a leadership meeting.
- Conversion rate: 6.1%, against a 4.2% site average — the comparison sits right on the card, so the figure arrives with context rather than in isolation.
- Bounce rate: 61%, against a 38% site average.
The bounce card is worth pausing on. AI-referred visitors currently bounce more than your site average, and the caption tells you why that’s common early: many arrive with their question already answered by the AI, and they came for one specific thing. The screen shows you the number plainly rather than tucking it away — which matters, because a channel you can only see the flattering side of isn’t one you can manage.
Read the two comparisons together, not separately. Higher bounce (61%) and higher conversion (6.1% vs 4.2%) is the true shape of AI-referred traffic: fewer pages per visit, more decisions per visit. Report both numbers to leadership in the same sentence — presenting only the favourable one is exactly the habit worth breaking.
The small print under the cards matters too: the site averages (4.2% conversion, 38% bounce) come from your connected Google Analytics account. They’re your numbers, not industry benchmarks.
Where they came from, and where they landed
Section titled “Where they came from, and where they landed”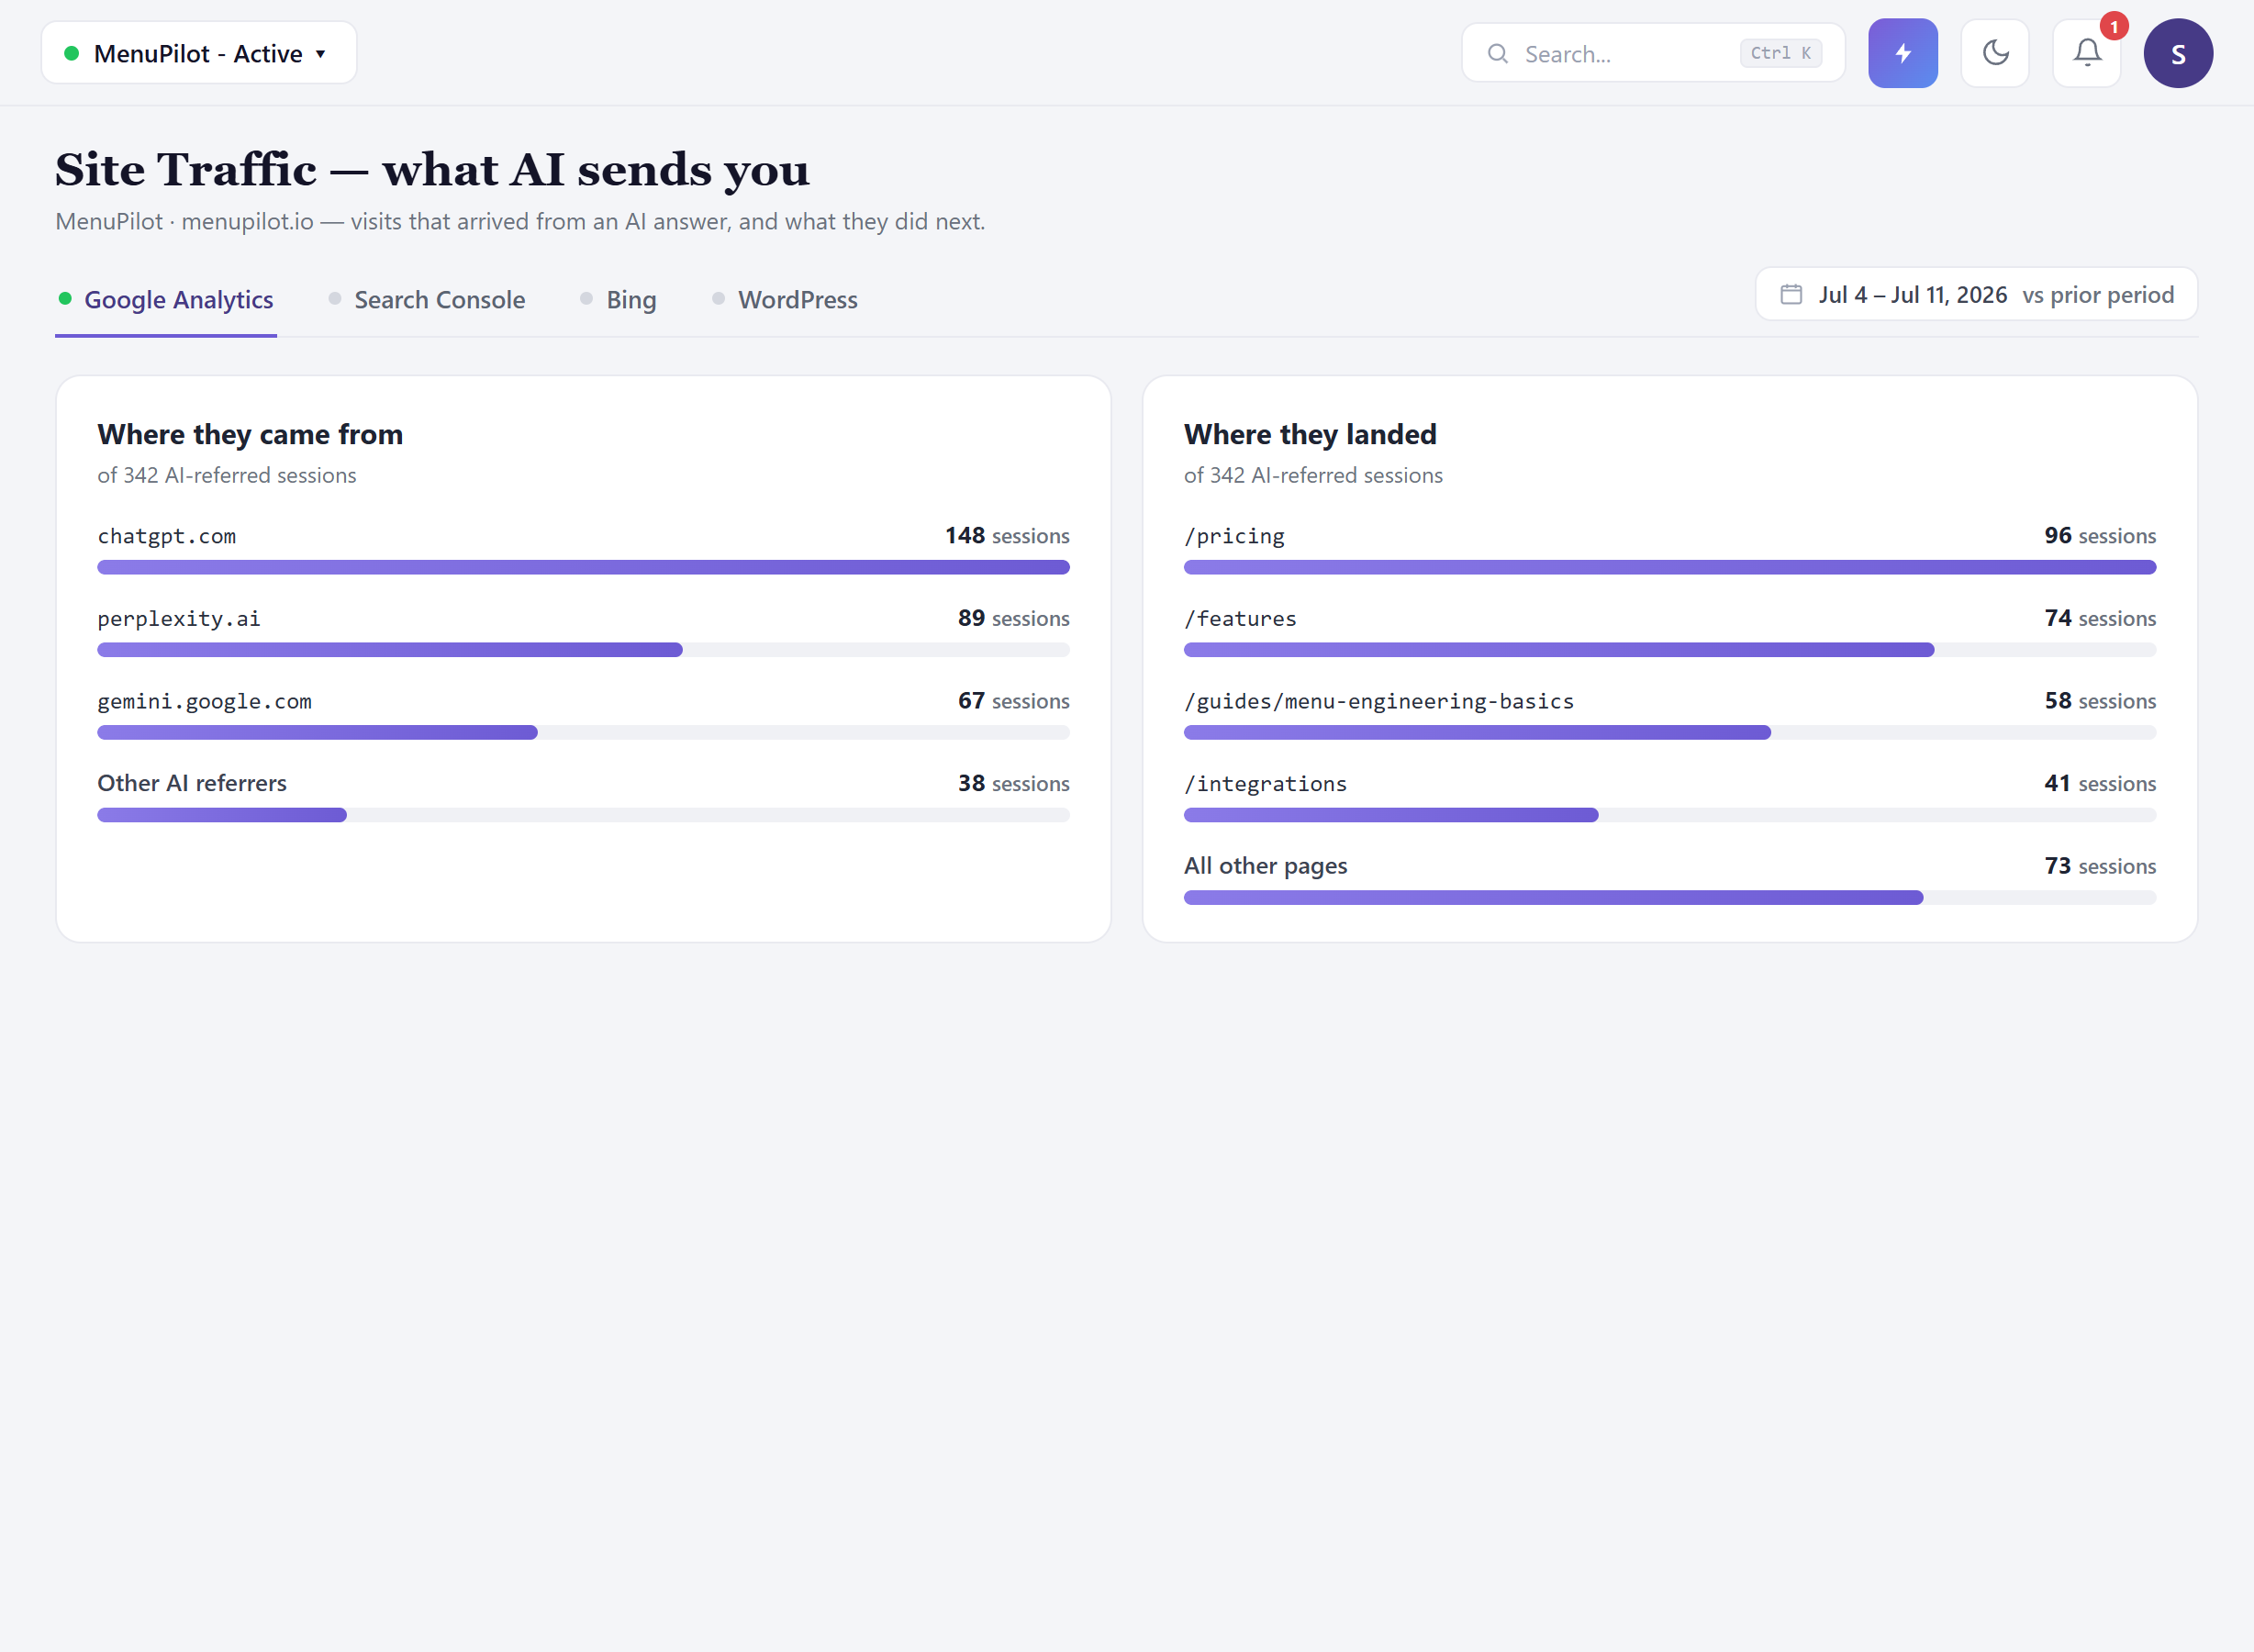 Two panels, each explicitly scoped to the same 342 AI-referred sessions so the parts always reconcile with the whole.
Where they came from: chatgpt.com (148), perplexity.ai (89), gemini.google.com (67), and other AI referrers (38). This is your engine mix expressed in actual visits — useful to compare against where your mentions happen, because the platform that talks about you most isn’t automatically the one that sends you the most people.
Where they landed: /pricing (96), /features (74), /guides/menu-engineering-basics (58), /integrations (41), and all other pages (73). Landing pages are intent signals. When /pricing is the top AI-referred destination, AI answers are sending you people who are already evaluating — which raises the stakes on every fact AI states about your pricing before the click.
Treat these numbers as a floor, not a ceiling. Referrer data is how these sessions are identified, and some AI-originated visits arrive without it — someone reads an AI answer, then types your address directly, and that visit lands in direct traffic. What you see here is the provable minimum of what AI sends you. The real figure is higher; how much higher, no analytics tool can honestly tell you.
Connecting more sources
Section titled “Connecting more sources”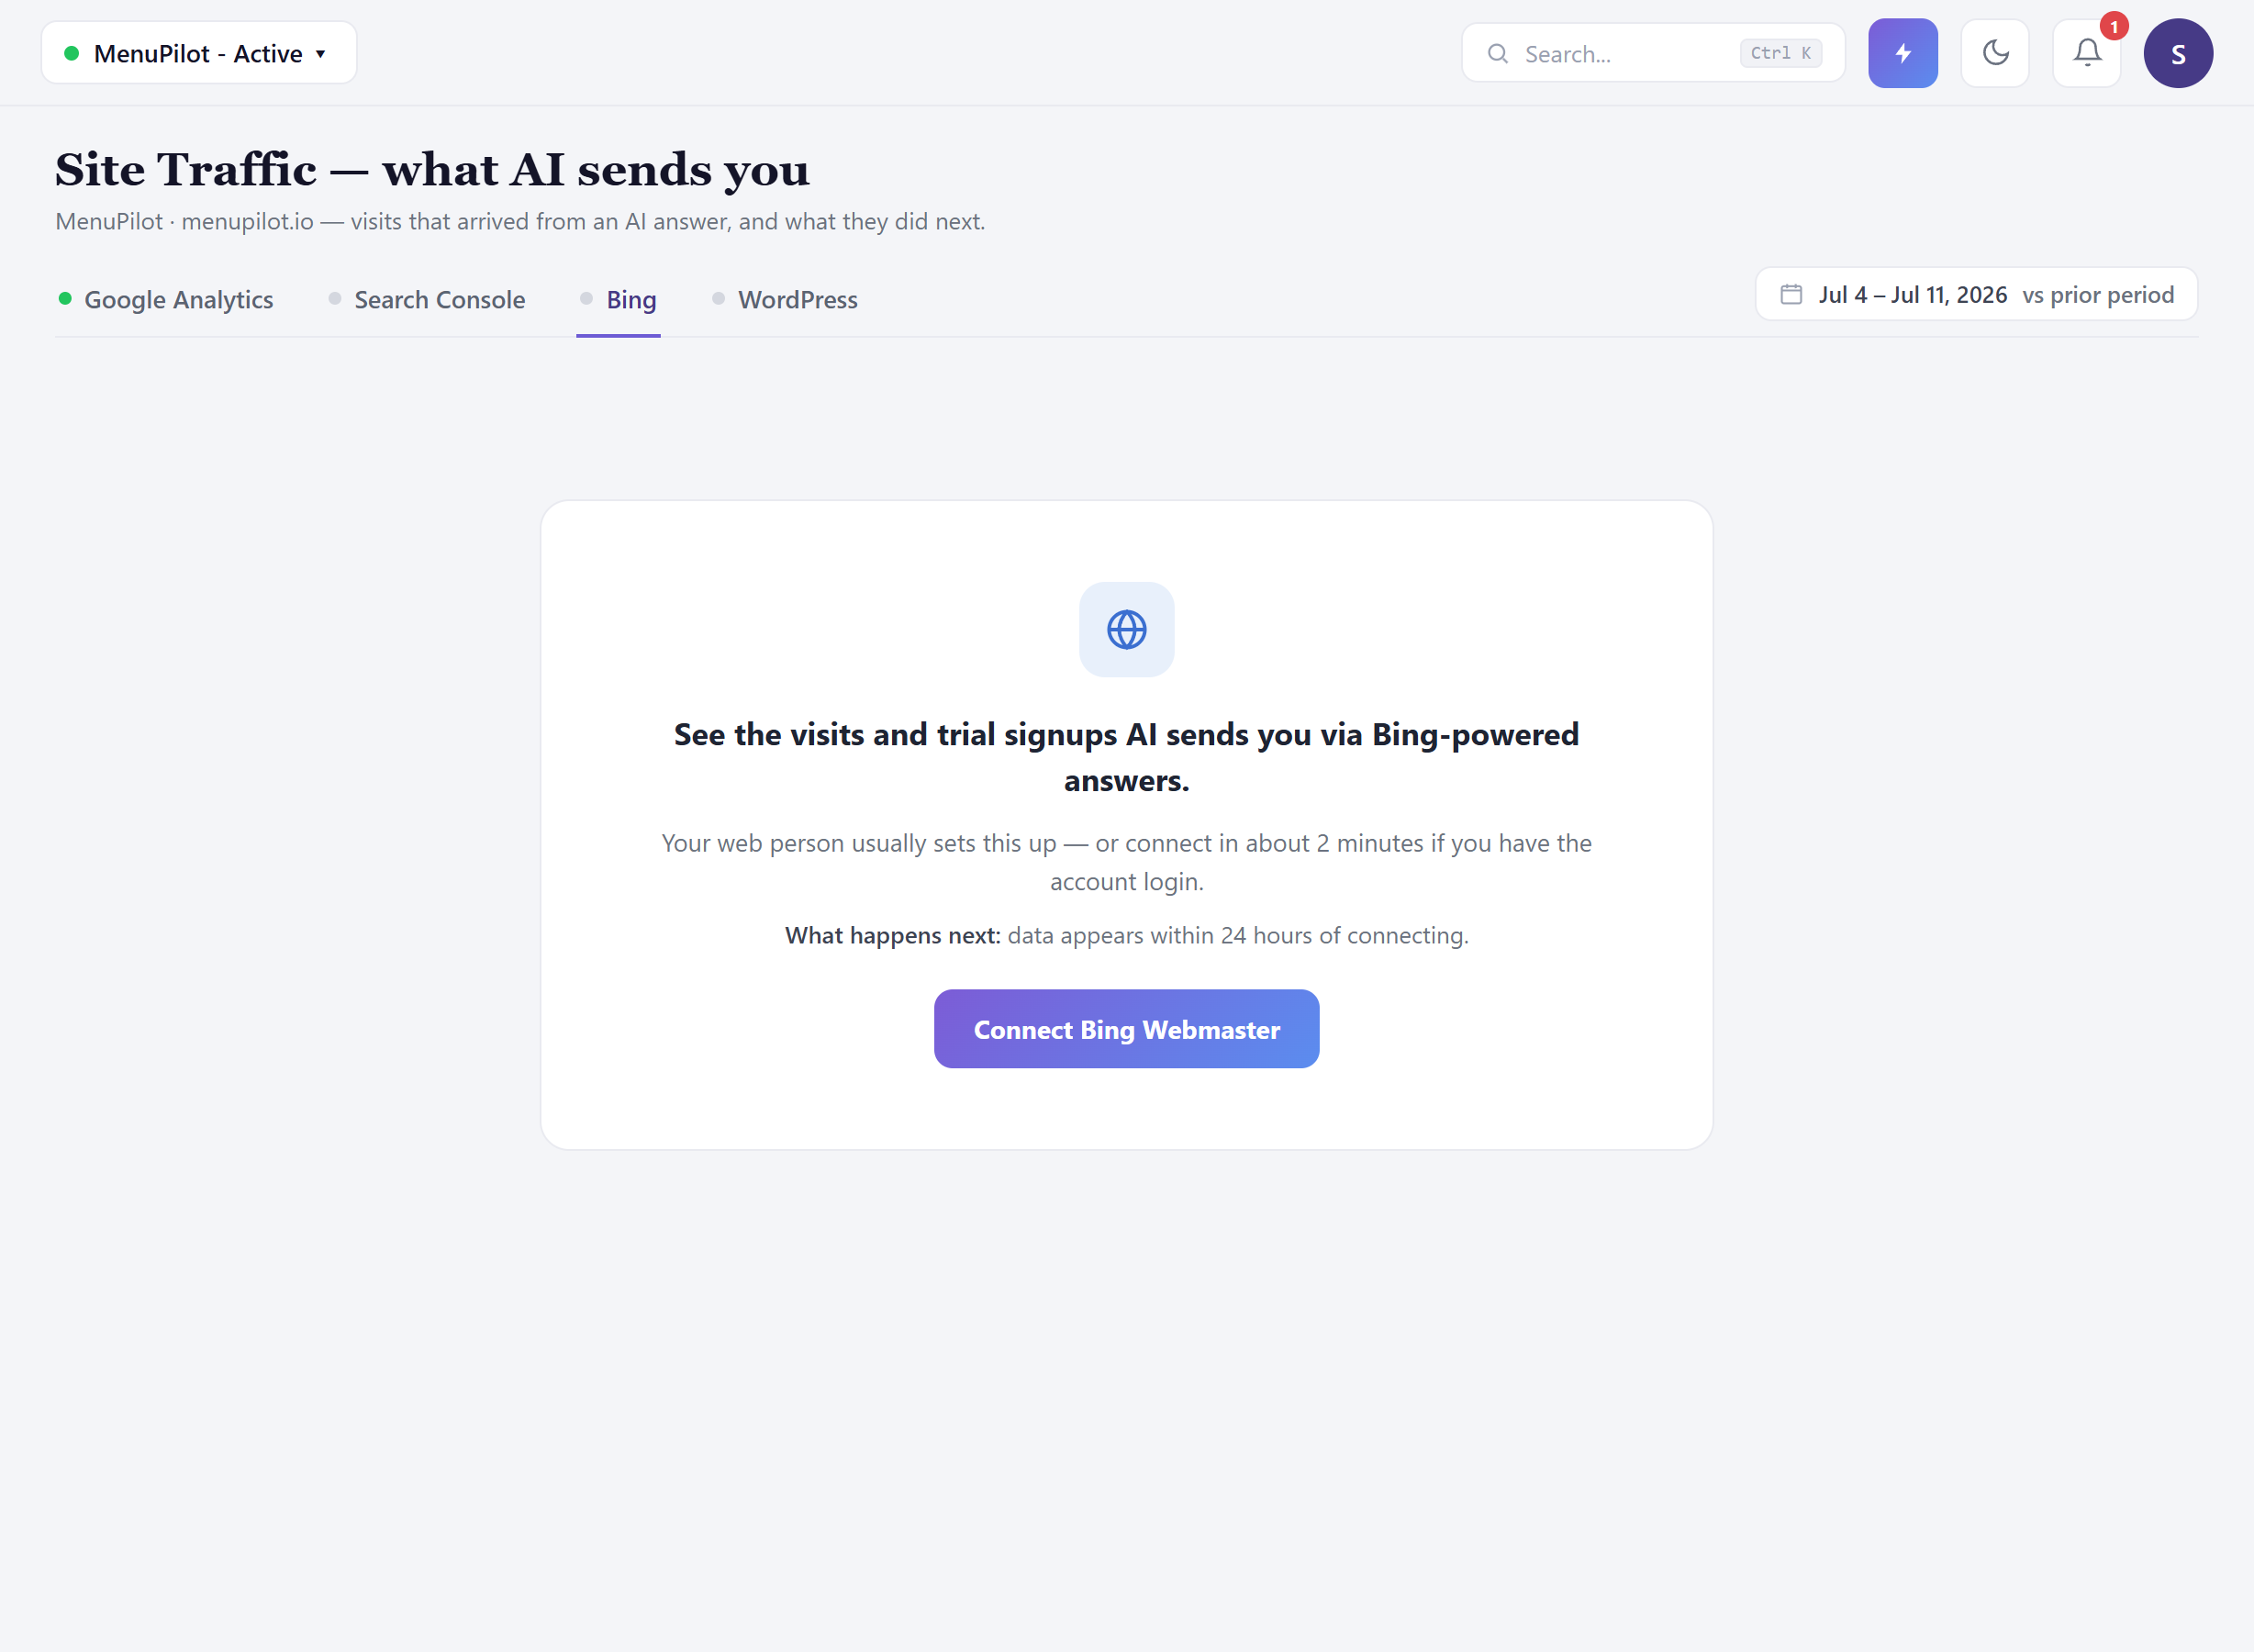 The source tabs cover Google Analytics, Search Console, Bing, and WordPress. Unconnected sources get a straightforward pitch rather than a blank page — the Bing tab explains what you’d see (visits and trial signups from Bing-powered answers), who usually sets it up (your web person, or you in a couple of minutes with the account login), and what happens next (data appears within about 24 hours of connecting). No connection, no fake numbers.
Guidance that may change as the product evolves: connection setup times and data-appearance windows are estimates. If your data hasn’t appeared on schedule, check the connection status chip first before assuming the channel is sending you nothing.
Common questions
Section titled “Common questions”Why is my AI-referred bounce rate so much higher than my site average? Because AI answers often resolve the visitor’s question before the click — what’s left is a visit with one purpose. Watch the conversion rate alongside it: if bounce is high and conversion is high, the channel is working. If both go the wrong way, look at whether the pages AI sends people to actually match what the AI told them.
The session count here doesn’t match what I see in my analytics tool. Why? This screen counts only sessions attributable to AI referrers, over the selected period. Your analytics tool’s totals include everything. If the same segment differs between the two, check that the date ranges and time zones match before anything else.
Is 342 sessions all the traffic AI sends me? It’s the provable part. AI-influenced visits that arrive without referrer data (direct visits after reading an answer, for instance) can’t be attributed here. Treat the trend as more meaningful than the absolute number.
An 18% jump sounds great — is it? On a base of 290, 18% is 52 additional sessions. Real, but keep the base size in view when reporting it, and watch whether the composition changed — a jump driven by one engine or one landing page tells a different story than broad growth.
When does data show up after I connect a source? Within about 24 hours for a new connection. Historical backfill depends on the source.
What to read next
Section titled “What to read next”- Action Center — the fixes and content that this screen exists to measure the payoff of.
- Citation Analysis — the step immediately before the click: who AI cites, and when it’s you.
- Visibility Gaps — if the traffic isn’t coming, this is where you find out what to change.